Fidelity National Information Services is a provider of technology solutions for merchants, banks, and capital markets firms globally. Co.'s segments are Merchant Solutions, which is focused on serving merchants of all sizes globally, enabling them to accept, authorize and settle electronic payment transactions; Banking Solutions, which is focused on serving financial institutions of all sizes with main processing software, transaction processing software and applications and services, many of which interact directly with main processing software; and Capital Market Solutions, which is focused on serving global financial services clients with an array of buy- and sell-side solutions.
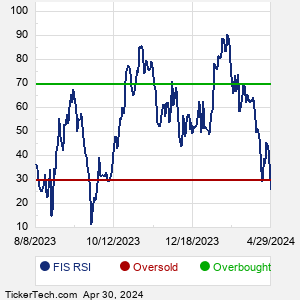
When researching a stock like Fidelity National Information Services, many investors are the most familiar with Fundamental Analysis — looking at a company's balance sheet, earnings, revenues, and what's happening in that company's underlying business. Investors who use Fundamental Analysis to identify good stocks to buy or sell can also benefit from FIS Technical Analysis to help find a good entry or exit point. Technical Analysis is blind to the fundamentals and looks only at the trading data for FIS stock — the real life supply and demand for the stock over time — and examines that data in different ways. One of these ways is called the Relative Strength Index, or RSI. This popular indicator, originally developed in the 1970's by J. Welles Wilder, looks at a 14-day moving average of a stock's gains on its up days, versus its losses on its down days. The resulting FIS RSI is a value that measures momentum, oscillating between "oversold" and "overbought" on a scale of zero to 100. A reading below 30 is viewed to be oversold, which a bullish investor could look to as a sign that the selling is in the process of exhausting itself, and look for entry point opportunities. A reading above 70 is viewed to be overbought, which could indicate that a rally in progress is starting to get crowded with buyers. If the rally has been a long one, that could be a sign that a pullback is overdue. |