FirstEnergy is a public utility holding company. Through its subsidiaries, Co. is engaged in the transmission, distribution and generation of electricity. Co.'s segments include: Regulated Distribution, which distributes electricity through its utility operating companies (including Ohio Edison Company, The Cleveland Electric Illuminating Company, The Toledo Edison Company, Pennsylvania Power Company and Jersey Central Power & Light Company); and Regulated Transmission, which provides transmission infrastructure owned and operated by the Transmission Companies and certain of Co.'s utilities to transmit electricity from generation sources to distribution facilities.
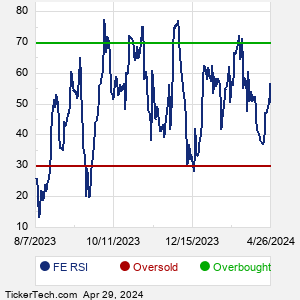
When researching a stock like FirstEnergy, many investors are the most familiar with Fundamental Analysis — looking at a company's balance sheet, earnings, revenues, and what's happening in that company's underlying business. Investors who use Fundamental Analysis to identify good stocks to buy or sell can also benefit from FE Technical Analysis to help find a good entry or exit point. Technical Analysis is blind to the fundamentals and looks only at the trading data for FE stock — the real life supply and demand for the stock over time — and examines that data in different ways. One of these ways is called the Relative Strength Index, or RSI. This popular indicator, originally developed in the 1970's by J. Welles Wilder, looks at a 14-day moving average of a stock's gains on its up days, versus its losses on its down days. The resulting FE RSI is a value that measures momentum, oscillating between "oversold" and "overbought" on a scale of zero to 100. A reading below 30 is viewed to be oversold, which a bullish investor could look to as a sign that the selling is in the process of exhausting itself, and look for entry point opportunities. A reading above 70 is viewed to be overbought, which could indicate that a rally in progress is starting to get crowded with buyers. If the rally has been a long one, that could be a sign that a pullback is overdue. |