Eastman Chemical is a global specialty materials company. Co.'s Additives and Functional Products segment manufactures materials for products in the transportation; personal care and wellness; food, feed, and agriculture; building and construction; water treatment and energy; consumables; and durables and electronics markets. Co.'s Advanced Materials segment produces and markets polymers, films, and plastics. Co.'s Chemical Intermediates segment sells and markets industrial chemicals and processing, building and construction, health and wellness, and agrochemicals. Co.'s Fibers segment manufactures and sells acetate tow and triacetin plasticizers for use in filtration media.
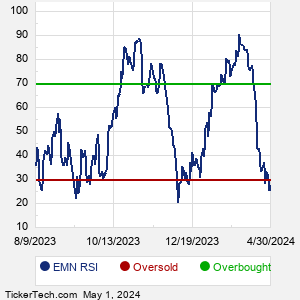
When researching a stock like Eastman Chemical, many investors are the most familiar with Fundamental Analysis — looking at a company's balance sheet, earnings, revenues, and what's happening in that company's underlying business. Investors who use Fundamental Analysis to identify good stocks to buy or sell can also benefit from EMN Technical Analysis to help find a good entry or exit point. Technical Analysis is blind to the fundamentals and looks only at the trading data for EMN stock — the real life supply and demand for the stock over time — and examines that data in different ways. One of these ways is called the Relative Strength Index, or RSI. This popular indicator, originally developed in the 1970's by J. Welles Wilder, looks at a 14-day moving average of a stock's gains on its up days, versus its losses on its down days. The resulting EMN RSI is a value that measures momentum, oscillating between "oversold" and "overbought" on a scale of zero to 100. A reading below 30 is viewed to be oversold, which a bullish investor could look to as a sign that the selling is in the process of exhausting itself, and look for entry point opportunities. A reading above 70 is viewed to be overbought, which could indicate that a rally in progress is starting to get crowded with buyers. If the rally has been a long one, that could be a sign that a pullback is overdue. |