DXC Technology is engaged in the global IT services market. Co. provides IT services. Co. operates through two segments: Global Business Services (GBS) and Global Infrastructure Services (GIS). GBS provides technology solutions that help Co.'s customers address main business challenges and accelerate transformations tailored to each customer's industry and specific objectives. GBS offerings include: Analytics and Engineering, Applications, and Insurance Software and Business Process Services. GIS provides a portfolio of technology offerings that deliver predictable outcomes and measurable results. GIS offerings include: Security, Cloud Infrastructure and IT Outsourcing, and Workplace.
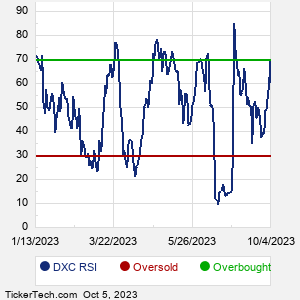
When researching a stock like DXC Technology, many investors are the most familiar with Fundamental Analysis — looking at a company's balance sheet, earnings, revenues, and what's happening in that company's underlying business. Investors who use Fundamental Analysis to identify good stocks to buy or sell can also benefit from DXC Technical Analysis to help find a good entry or exit point. Technical Analysis is blind to the fundamentals and looks only at the trading data for DXC stock — the real life supply and demand for the stock over time — and examines that data in different ways. One of these ways is called the Relative Strength Index, or RSI. This popular indicator, originally developed in the 1970's by J. Welles Wilder, looks at a 14-day moving average of a stock's gains on its up days, versus its losses on its down days. The resulting DXC RSI is a value that measures momentum, oscillating between "oversold" and "overbought" on a scale of zero to 100. A reading below 30 is viewed to be oversold, which a bullish investor could look to as a sign that the selling is in the process of exhausting itself, and look for entry point opportunities. A reading above 70 is viewed to be overbought, which could indicate that a rally in progress is starting to get crowded with buyers. If the rally has been a long one, that could be a sign that a pullback is overdue. |