DTE Energy is a holding company. Through its subsidiaries, DTE Electric Company (DTE Electric) and DTE Gas Company (DTE Gas), Co. is engaged in the utility business. Co.'s segments include: Electric, which consists of DTE Electric that engages in the generation, purchase, distribution, and sale of electricity; Gas, which consists of DTE Gas that engages in the purchase, storage, transportation, distribution, and sale of natural gas; DTE Vantage, which is primarily involved in renewable natural gas projects and providing custom energy solutions to customers; and Energy Trading, which focuses on physical and financial power, natural gas and environmental marketing and trading.
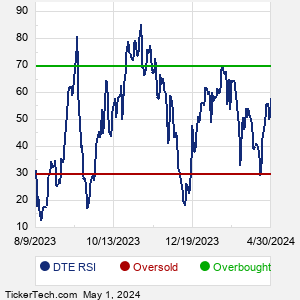
When researching a stock like DTE Energy, many investors are the most familiar with Fundamental Analysis — looking at a company's balance sheet, earnings, revenues, and what's happening in that company's underlying business. Investors who use Fundamental Analysis to identify good stocks to buy or sell can also benefit from DTE Technical Analysis to help find a good entry or exit point. Technical Analysis is blind to the fundamentals and looks only at the trading data for DTE stock — the real life supply and demand for the stock over time — and examines that data in different ways. One of these ways is called the Relative Strength Index, or RSI. This popular indicator, originally developed in the 1970's by J. Welles Wilder, looks at a 14-day moving average of a stock's gains on its up days, versus its losses on its down days. The resulting DTE RSI is a value that measures momentum, oscillating between "oversold" and "overbought" on a scale of zero to 100. A reading below 30 is viewed to be oversold, which a bullish investor could look to as a sign that the selling is in the process of exhausting itself, and look for entry point opportunities. A reading above 70 is viewed to be overbought, which could indicate that a rally in progress is starting to get crowded with buyers. If the rally has been a long one, that could be a sign that a pullback is overdue. |