Danaher designs, manufactures and markets medical, industrial and commercial products and services. Co.'s segments are: Biotechnology, which includes the bioprocessing and discovery and medical businesses and provides tools, consumables and services; Life Sciences, which provides instruments and consumables to understand the causes of disease, identify new therapies, and test and manufacture new drugs, vaccines and gene editing technologies; Diagnostics, which provides clinical instruments, reagents, consumables, software and services; and Environmental and Applied Solutions, which provides products and services that help protect resources and keep global food and water supplies safe.
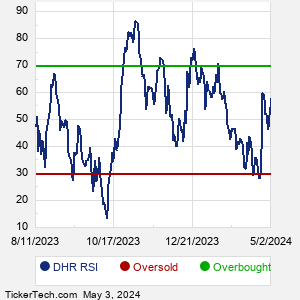
When researching a stock like Danaher, many investors are the most familiar with Fundamental Analysis — looking at a company's balance sheet, earnings, revenues, and what's happening in that company's underlying business. Investors who use Fundamental Analysis to identify good stocks to buy or sell can also benefit from DHR Technical Analysis to help find a good entry or exit point. Technical Analysis is blind to the fundamentals and looks only at the trading data for DHR stock — the real life supply and demand for the stock over time — and examines that data in different ways. One of these ways is called the Relative Strength Index, or RSI. This popular indicator, originally developed in the 1970's by J. Welles Wilder, looks at a 14-day moving average of a stock's gains on its up days, versus its losses on its down days. The resulting DHR RSI is a value that measures momentum, oscillating between "oversold" and "overbought" on a scale of zero to 100. A reading below 30 is viewed to be oversold, which a bullish investor could look to as a sign that the selling is in the process of exhausting itself, and look for entry point opportunities. A reading above 70 is viewed to be overbought, which could indicate that a rally in progress is starting to get crowded with buyers. If the rally has been a long one, that could be a sign that a pullback is overdue. |