Coterra Energy is an independent oil and gas company engaged in the development, exploration and production of oil, natural gas and natural gas liquids. Co.'s assets are concentrated in areas with known hydrocarbon resources, which are conducive to multi-well, repeatable development programs. Co. operates in one segment, oil and natural gas development, exploration and production, in the continental U.S. Co.'s operations are primarily concentrated in three operating areas, the Marcellus Shale in northeast Pennsylvania, the Permian Basin in west Texas and southeast New Mexico and the Anadarko Basin in the Mid-Continent region in Oklahoma.
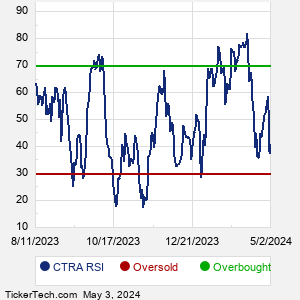
When researching a stock like Coterra Energy, many investors are the most familiar with Fundamental Analysis — looking at a company's balance sheet, earnings, revenues, and what's happening in that company's underlying business. Investors who use Fundamental Analysis to identify good stocks to buy or sell can also benefit from CTRA Technical Analysis to help find a good entry or exit point. Technical Analysis is blind to the fundamentals and looks only at the trading data for CTRA stock — the real life supply and demand for the stock over time — and examines that data in different ways. One of these ways is called the Relative Strength Index, or RSI. This popular indicator, originally developed in the 1970's by J. Welles Wilder, looks at a 14-day moving average of a stock's gains on its up days, versus its losses on its down days. The resulting CTRA RSI is a value that measures momentum, oscillating between "oversold" and "overbought" on a scale of zero to 100. A reading below 30 is viewed to be oversold, which a bullish investor could look to as a sign that the selling is in the process of exhausting itself, and look for entry point opportunities. A reading above 70 is viewed to be overbought, which could indicate that a rally in progress is starting to get crowded with buyers. If the rally has been a long one, that could be a sign that a pullback is overdue. |