Cintas is a provider of corporate identity uniforms through rental and sales programs, as well as a provider of related business services, including entrance mats, restroom cleaning services and supplies, first aid and safety services and fire protection products and services. Co.'s reportable operating segments are the Uniform Rental and Facility Services, which consists of the rental and servicing of uniforms and other garments, including flame resistant clothing, mats, mops and shop towels and other ancillary items; and the First Aid and Safety Services, which consists of first aid and safety products and services.
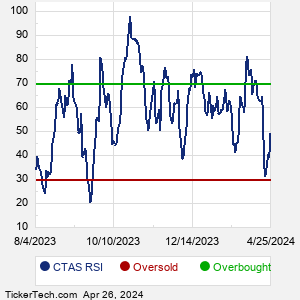
When researching a stock like Cintas, many investors are the most familiar with Fundamental Analysis — looking at a company's balance sheet, earnings, revenues, and what's happening in that company's underlying business. Investors who use Fundamental Analysis to identify good stocks to buy or sell can also benefit from CTAS Technical Analysis to help find a good entry or exit point. Technical Analysis is blind to the fundamentals and looks only at the trading data for CTAS stock — the real life supply and demand for the stock over time — and examines that data in different ways. One of these ways is called the Relative Strength Index, or RSI. This popular indicator, originally developed in the 1970's by J. Welles Wilder, looks at a 14-day moving average of a stock's gains on its up days, versus its losses on its down days. The resulting CTAS RSI is a value that measures momentum, oscillating between "oversold" and "overbought" on a scale of zero to 100. A reading below 30 is viewed to be oversold, which a bullish investor could look to as a sign that the selling is in the process of exhausting itself, and look for entry point opportunities. A reading above 70 is viewed to be overbought, which could indicate that a rally in progress is starting to get crowded with buyers. If the rally has been a long one, that could be a sign that a pullback is overdue. |