ConocoPhillips is an independent exploration and production company which explores for, produces, transports and markets crude oil, bitumen, natural gas, liquefied natural gas and natural gas liquids. Co.'s segments are: Alaska, which operates in Alaska; Lower 48, which operates in the U.S. states and the Gulf of Mexico; Canada, which operates in Alberta and British Columbia, Canada; Europe, Middle East and North Africa, which includes operations located in the Norwegian sector of the North Sea, the Norwegian Sea, and terminalling operations in the U.K.; Asia Pacific, which operates in China, Indonesia, Malaysia and Australia; and Other International, which includes activities in Colombia.
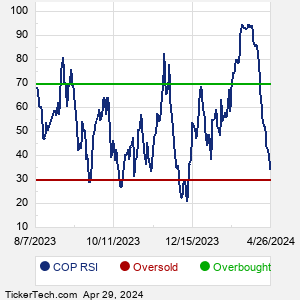
When researching a stock like ConocoPhillips, many investors are the most familiar with Fundamental Analysis — looking at a company's balance sheet, earnings, revenues, and what's happening in that company's underlying business. Investors who use Fundamental Analysis to identify good stocks to buy or sell can also benefit from COP Technical Analysis to help find a good entry or exit point. Technical Analysis is blind to the fundamentals and looks only at the trading data for COP stock — the real life supply and demand for the stock over time — and examines that data in different ways. One of these ways is called the Relative Strength Index, or RSI. This popular indicator, originally developed in the 1970's by J. Welles Wilder, looks at a 14-day moving average of a stock's gains on its up days, versus its losses on its down days. The resulting COP RSI is a value that measures momentum, oscillating between "oversold" and "overbought" on a scale of zero to 100. A reading below 30 is viewed to be oversold, which a bullish investor could look to as a sign that the selling is in the process of exhausting itself, and look for entry point opportunities. A reading above 70 is viewed to be overbought, which could indicate that a rally in progress is starting to get crowded with buyers. If the rally has been a long one, that could be a sign that a pullback is overdue. |