The Cigna Group, together with its subsidiaries, is a global health service organization. Co.'s segments include: Evernorth, which includes a range of coordinated and point solution health services, as well as those from partners across the health care system, in pharmacy solutions, benefits management solutions, care delivery and care management solutions and other solutions; Cigna Healthcare, which includes Co.'s U.S. Commercial, U.S. Government and International Health operating segments that provide medical and coordinated solutions to clients and customers; and Other Operations, which includes ongoing business, exiting business, and run-off businesses.
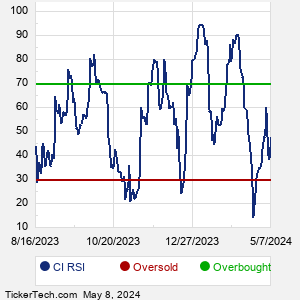
When researching a stock like Cigna, many investors are the most familiar with Fundamental Analysis — looking at a company's balance sheet, earnings, revenues, and what's happening in that company's underlying business. Investors who use Fundamental Analysis to identify good stocks to buy or sell can also benefit from CI Technical Analysis to help find a good entry or exit point. Technical Analysis is blind to the fundamentals and looks only at the trading data for CI stock — the real life supply and demand for the stock over time — and examines that data in different ways. One of these ways is called the Relative Strength Index, or RSI. This popular indicator, originally developed in the 1970's by J. Welles Wilder, looks at a 14-day moving average of a stock's gains on its up days, versus its losses on its down days. The resulting CI RSI is a value that measures momentum, oscillating between "oversold" and "overbought" on a scale of zero to 100. A reading below 30 is viewed to be oversold, which a bullish investor could look to as a sign that the selling is in the process of exhausting itself, and look for entry point opportunities. A reading above 70 is viewed to be overbought, which could indicate that a rally in progress is starting to get crowded with buyers. If the rally has been a long one, that could be a sign that a pullback is overdue. |