Celgene RSI


As of date:11/20/2019
CELG stock price:108.24
CELG RSI:51.63
Extremely
Overbought
Overbought/Oversold RSI Range
RSI Indicator (Relative Strength Index)51.63
Extremely
Oversold

Also see:
CELG Market Cap History
CELG Shares Outstanding History
CELG YTD Return
CELG DMA
CELG MACD
CELG Technical Analysis

CSTL Makes Notable Cross Below Critical Moving Average
1 hour, 44 minutes ago


DuPont Breaks Below 200-Day Moving Average - Notable for DD
1 hour, 45 minutes ago


FHTX Makes Notable Cross Below Critical Moving Average
1 hour, 47 minutes ago


Nextracker Breaks Below 200-Day Moving Average - Notable for NXT
1 hour, 47 minutes ago


Trump Media & Technology Group (DJT) Shares Cross Below 200 DMA
1 hour, 48 minutes ago


SPT Makes Notable Cross Below Critical Moving Average
2 hours, 5 minutes ago


DFCF Enters Oversold Territory
2 hours, 5 minutes ago


Ford Motor Breaks Below 200-Day Moving Average - Notable for F
2 hours, 5 minutes ago


Baxter International Breaks Below 200-Day Moving Average - Notable for BAX
2 hours, 5 minutes ago


WMG Crosses Below Key Moving Average Level
2 hours, 5 minutes ago


SPDR S&P Global Infrastructure Breaks Below 200-Day Moving Average - Notable for GII
2 hours, 13 minutes ago


SITE Centers (SITC) Shares Cross Below 200 DMA
2 hours, 14 minutes ago


First Trust Emerging Markets Small Cap AlphaDEX Fund (FEMS) Shares Cross Below 200 DMA
2 hours, 14 minutes ago


HAUZ Breaks Below 200-Day Moving Average - Notable for HAUZ
2 hours, 14 minutes ago


NFRA Breaks Below 200-Day Moving Average - Notable for NFRA
2 hours, 17 minutes ago


More Technical Analysis News

CELG RSICELG DMA
Bristol-Myers Squibb is engaged in the discovery, development, licensing, manufacturing, marketing, distribution and sale of biopharmaceutical products on a global basis. Co.'s pharmaceutical products include chemically-synthesized or small molecule drugs, products produced from biological processes, called biologics and chimeric antigen receptor T-cell therapies. Co.'s primary product includes Eliquis® - Eliquis (apixaban), which is an oral Factor Xa inhibitor indicated for the reduction in risk of stroke/systemic embolism in non-valvular atrial fibrillation and for the treatment of DVT/PE and reduction in risk of recurrence following initial therapy.

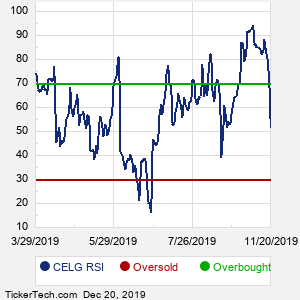
When researching a stock like Celgene, many investors are the most familiar with Fundamental Analysis — looking at a company's balance sheet, earnings, revenues, and what's happening in that company's underlying business. Investors who use Fundamental Analysis to identify good stocks to buy or sell can also benefit from CELG Technical Analysis to help find a good entry or exit point. Technical Analysis is blind to the fundamentals and looks only at the trading data for CELG stock — the real life supply and demand for the stock over time — and examines that data in different ways. One of these ways is called the Relative Strength Index, or RSI. This popular indicator, originally developed in the 1970's by J. Welles Wilder, looks at a 14-day moving average of a stock's gains on its up days, versus its losses on its down days. The resulting CELG RSI is a value that measures momentum, oscillating between "oversold" and "overbought" on a scale of zero to 100. A reading below 30 is viewed to be oversold, which a bullish investor could look to as a sign that the selling is in the process of exhausting itself, and look for entry point opportunities. A reading above 70 is viewed to be overbought, which could indicate that a rally in progress is starting to get crowded with buyers. If the rally has been a long one, that could be a sign that a pullback is overdue.
10 Most Oversold S&P 500 Stocks
10 Most Overbought S&P 500 Stocks

10 ETFs With Stocks Insiders Are Buying
10 ETFs With Most Upside To Targets
The DividendRank Top 25
Warren Buffett Dividend Stocks
10 Cheap Dividend Stocks Under $10
10 Top DividendRank'ed Energy Stocks
The 10 Highest Yielding Preferred Stocks
The 15 Most Active S&P Call & Put Options
Quotes delayed 20 minutes

Email EnvelopeFree CELG Email Alerts:
Get Dividend Alerts
Get SEC Filing Alerts
Video: RSI Indicator


If the video does not load after a few moments, Upgrade to the Latest Flash Player.
 

Celgene RSI | www.StockRSI.com | Copyright © 2019 - 2024, All Rights Reserved

Nothing in StockRSI.com is intended to be investment advice, nor does it represent the opinion of, counsel from, or recommendations by BNK Invest Inc. or any of its affiliates, subsidiaries or partners. None of the information contained herein constitutes a recommendation that any particular security, portfolio, transaction, or investment strategy is suitable for any specific person. All viewers agree that under no circumstances will BNK Invest, Inc,. its subsidiaries, partners, officers, employees, affiliates, or agents be held liable for any loss or damage caused by your reliance on information obtained. By visiting, using or viewing this site, you agree to the following Full Disclaimer & Terms of Use and Privacy Policy. Video widget and market videos powered by Market News Video. Quote and option data delayed at least 15 minutes; stock quote data powered by Ticker Technologies, and Mergent.
X
Wait! Don't leave yet.
Want to receive our latest research absolutely free?


Click the button below for your complimentary copy of Your Early Retirement Portfolio: Dividends Up to 8.7%—Every Month—Forever.

You'll discover the details on 4 stocks and funds that pay you massive dividends as high as 8.7%.