Chubb, through its subsidiaries, is an insurance and reinsurance organization. Co. provides commercial and personal property and casualty insurance, personal accident and supplemental health insurance, reinsurance, and life insurance. Co. provides commercial insurance products and service offerings such as risk management programs, loss control, and engineering and claims management, as well as insurance products ranging from Directors & Officers and professional liability to various specialty-casualty and umbrella and excess casualty lines. Co. also provides personal lines insurance coverage including homeowners, automobile, valuables, umbrella liability, and recreational marine products.
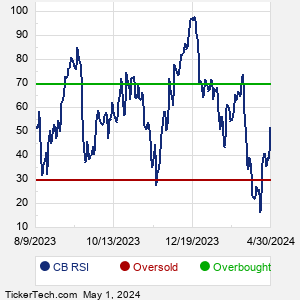
When researching a stock like Chubb, many investors are the most familiar with Fundamental Analysis — looking at a company's balance sheet, earnings, revenues, and what's happening in that company's underlying business. Investors who use Fundamental Analysis to identify good stocks to buy or sell can also benefit from CB Technical Analysis to help find a good entry or exit point. Technical Analysis is blind to the fundamentals and looks only at the trading data for CB stock — the real life supply and demand for the stock over time — and examines that data in different ways. One of these ways is called the Relative Strength Index, or RSI. This popular indicator, originally developed in the 1970's by J. Welles Wilder, looks at a 14-day moving average of a stock's gains on its up days, versus its losses on its down days. The resulting CB RSI is a value that measures momentum, oscillating between "oversold" and "overbought" on a scale of zero to 100. A reading below 30 is viewed to be oversold, which a bullish investor could look to as a sign that the selling is in the process of exhausting itself, and look for entry point opportunities. A reading above 70 is viewed to be overbought, which could indicate that a rally in progress is starting to get crowded with buyers. If the rally has been a long one, that could be a sign that a pullback is overdue. |