Brown & Brown is an insurance agency, wholesale brokerage, insurance programs and service organization. Co.'s segments are: Retail, which provides a range of insurance products and services and non-insurance services and products through its automobile dealer services businesses; National Programs, which provides program management capabilities for insurance carrier partners across various lines of business, that include personal lines programs, commercial lines programs, public entity programs and specialty programs; Wholesale Brokerage, which markets and sells excess and surplus commercial insurance products and services; and Services, which provides a range of insurance-related services.
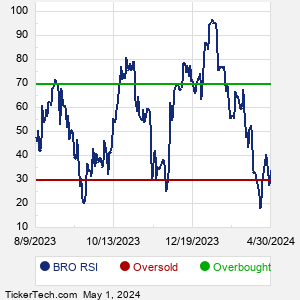
When researching a stock like Brown and Brown, many investors are the most familiar with Fundamental Analysis — looking at a company's balance sheet, earnings, revenues, and what's happening in that company's underlying business. Investors who use Fundamental Analysis to identify good stocks to buy or sell can also benefit from BRO Technical Analysis to help find a good entry or exit point. Technical Analysis is blind to the fundamentals and looks only at the trading data for BRO stock — the real life supply and demand for the stock over time — and examines that data in different ways. One of these ways is called the Relative Strength Index, or RSI. This popular indicator, originally developed in the 1970's by J. Welles Wilder, looks at a 14-day moving average of a stock's gains on its up days, versus its losses on its down days. The resulting BRO RSI is a value that measures momentum, oscillating between "oversold" and "overbought" on a scale of zero to 100. A reading below 30 is viewed to be oversold, which a bullish investor could look to as a sign that the selling is in the process of exhausting itself, and look for entry point opportunities. A reading above 70 is viewed to be overbought, which could indicate that a rally in progress is starting to get crowded with buyers. If the rally has been a long one, that could be a sign that a pullback is overdue. |