The Boeing is an aerospace firm. Co. operates in four reportable segments: Commercial Airplanes, which develops, produces and markets commercial jet aircraft principally to the commercial airline industry; Defense, Space and Security, which engages in the research, development, production and modification of manned and unmanned military aircraft and weapons systems; Global Services, which sustains aerospace platforms and systems with a range of products and services; and Boeing Capital, which seeks to ensure that Co.'s customers have the financing they need to buy and take delivery of their Boeing product, while managing overall financing exposure.
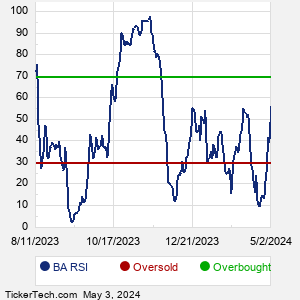
When researching a stock like Boeing, many investors are the most familiar with Fundamental Analysis — looking at a company's balance sheet, earnings, revenues, and what's happening in that company's underlying business. Investors who use Fundamental Analysis to identify good stocks to buy or sell can also benefit from BA Technical Analysis to help find a good entry or exit point. Technical Analysis is blind to the fundamentals and looks only at the trading data for BA stock — the real life supply and demand for the stock over time — and examines that data in different ways. One of these ways is called the Relative Strength Index, or RSI. This popular indicator, originally developed in the 1970's by J. Welles Wilder, looks at a 14-day moving average of a stock's gains on its up days, versus its losses on its down days. The resulting BA RSI is a value that measures momentum, oscillating between "oversold" and "overbought" on a scale of zero to 100. A reading below 30 is viewed to be oversold, which a bullish investor could look to as a sign that the selling is in the process of exhausting itself, and look for entry point opportunities. A reading above 70 is viewed to be overbought, which could indicate that a rally in progress is starting to get crowded with buyers. If the rally has been a long one, that could be a sign that a pullback is overdue. |