Arconic is engaged in manufacturing aluminum sheet, plate, extrusions and architectural products and systems, serving primarily the ground transportation, aerospace, building and construction, industrial, and packaging end markets. Co.'s three segments are: Rolled Products, which produces a range of aluminum sheet and plate; Building and Construction Systems, which manufactures various products and building envelope solutions, including entrances, curtain walls, windows, composite panel and coil coated sheet; and Extrusions, which produces a range of extruded products, including automotive shapes, aerospace shapes, tube, hollows, mortar fins, and high strength rod and bar.
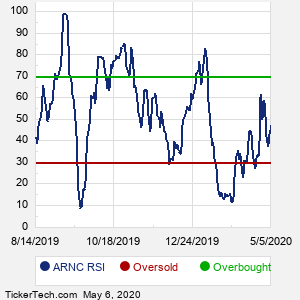
When researching a stock like Arconic, many investors are the most familiar with Fundamental Analysis — looking at a company's balance sheet, earnings, revenues, and what's happening in that company's underlying business. Investors who use Fundamental Analysis to identify good stocks to buy or sell can also benefit from ARNC Technical Analysis to help find a good entry or exit point. Technical Analysis is blind to the fundamentals and looks only at the trading data for ARNC stock — the real life supply and demand for the stock over time — and examines that data in different ways. One of these ways is called the Relative Strength Index, or RSI. This popular indicator, originally developed in the 1970's by J. Welles Wilder, looks at a 14-day moving average of a stock's gains on its up days, versus its losses on its down days. The resulting ARNC RSI is a value that measures momentum, oscillating between "oversold" and "overbought" on a scale of zero to 100. A reading below 30 is viewed to be oversold, which a bullish investor could look to as a sign that the selling is in the process of exhausting itself, and look for entry point opportunities. A reading above 70 is viewed to be overbought, which could indicate that a rally in progress is starting to get crowded with buyers. If the rally has been a long one, that could be a sign that a pullback is overdue. |