Amphenol is a designer, manufacturer and marketer of electrical, electronic and fiber optic connectors and interconnect systems, antennas, sensors and sensor-based products and coaxial and high-speed cable. Co.'s segments include: Interconnect Products and Assemblies, which designs, manufactures and markets a range of connector and connector systems, other products, including antennas and sensors, used in a range of applications in a set of end markets; and Cable Products and Solutions, which designs, manufactures and markets cable, products and components for use primarily in the broadband communications and information technology markets as well as certain applications in other markets.
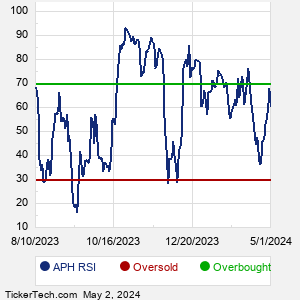
When researching a stock like Amphenol, many investors are the most familiar with Fundamental Analysis — looking at a company's balance sheet, earnings, revenues, and what's happening in that company's underlying business. Investors who use Fundamental Analysis to identify good stocks to buy or sell can also benefit from APH Technical Analysis to help find a good entry or exit point. Technical Analysis is blind to the fundamentals and looks only at the trading data for APH stock — the real life supply and demand for the stock over time — and examines that data in different ways. One of these ways is called the Relative Strength Index, or RSI. This popular indicator, originally developed in the 1970's by J. Welles Wilder, looks at a 14-day moving average of a stock's gains on its up days, versus its losses on its down days. The resulting APH RSI is a value that measures momentum, oscillating between "oversold" and "overbought" on a scale of zero to 100. A reading below 30 is viewed to be oversold, which a bullish investor could look to as a sign that the selling is in the process of exhausting itself, and look for entry point opportunities. A reading above 70 is viewed to be overbought, which could indicate that a rally in progress is starting to get crowded with buyers. If the rally has been a long one, that could be a sign that a pullback is overdue. |