Automatic Data Processing is a provider of cloud-based human capital management (HCM) solutions. Co. classifies its operations into the following two reportable segments: Employer Services, which serves clients ranging from single-employee small businesses to large enterprises, providing a range of technology-based HCM solutions, including payroll services, human resources management, workforce management, compliance services, insurance services and retirement services; and Professional Employer Organization, which provides clients with employment administration outsourcing solutions through a relationship in which employees who work for a client are co-employed by Co. and the client.
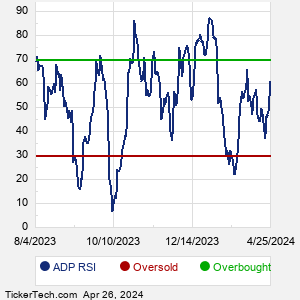
When researching a stock like Automatic Data Processing, many investors are the most familiar with Fundamental Analysis — looking at a company's balance sheet, earnings, revenues, and what's happening in that company's underlying business. Investors who use Fundamental Analysis to identify good stocks to buy or sell can also benefit from ADP Technical Analysis to help find a good entry or exit point. Technical Analysis is blind to the fundamentals and looks only at the trading data for ADP stock — the real life supply and demand for the stock over time — and examines that data in different ways. One of these ways is called the Relative Strength Index, or RSI. This popular indicator, originally developed in the 1970's by J. Welles Wilder, looks at a 14-day moving average of a stock's gains on its up days, versus its losses on its down days. The resulting ADP RSI is a value that measures momentum, oscillating between "oversold" and "overbought" on a scale of zero to 100. A reading below 30 is viewed to be oversold, which a bullish investor could look to as a sign that the selling is in the process of exhausting itself, and look for entry point opportunities. A reading above 70 is viewed to be overbought, which could indicate that a rally in progress is starting to get crowded with buyers. If the rally has been a long one, that could be a sign that a pullback is overdue. |