Archer Daniels Midland is a human and animal nutrition and an agricultural origination and processing company. The Ag Services and Oilseeds segment includes activities related to the origination, merchandising, transportation, and storage of agricultural raw materials, and the crushing and further processing of oilseeds into vegetable oils and protein meals. The Carbohydrate Solutions segment is engaged in corn and wheat wet and dry milling and other activities. The Nutrition segment serves various end markets including food, beverages, nutritional supplements, and feed and premix for livestock, aquaculture, and pet food.
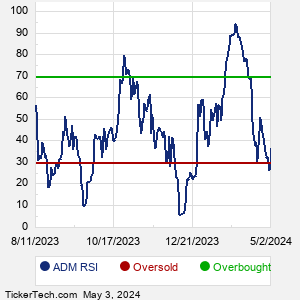
When researching a stock like Archer Daniels Midland, many investors are the most familiar with Fundamental Analysis — looking at a company's balance sheet, earnings, revenues, and what's happening in that company's underlying business. Investors who use Fundamental Analysis to identify good stocks to buy or sell can also benefit from ADM Technical Analysis to help find a good entry or exit point. Technical Analysis is blind to the fundamentals and looks only at the trading data for ADM stock — the real life supply and demand for the stock over time — and examines that data in different ways. One of these ways is called the Relative Strength Index, or RSI. This popular indicator, originally developed in the 1970's by J. Welles Wilder, looks at a 14-day moving average of a stock's gains on its up days, versus its losses on its down days. The resulting ADM RSI is a value that measures momentum, oscillating between "oversold" and "overbought" on a scale of zero to 100. A reading below 30 is viewed to be oversold, which a bullish investor could look to as a sign that the selling is in the process of exhausting itself, and look for entry point opportunities. A reading above 70 is viewed to be overbought, which could indicate that a rally in progress is starting to get crowded with buyers. If the rally has been a long one, that could be a sign that a pullback is overdue. |