Analog Devices is a semiconductor company. Co. designs, manufactures, tests and markets a portfolio of solutions, including integrated circuits, software and subsystems. Co.'s products include: analog and mixed signal, which include data converter products; power management and reference, which include functions such as power conversion, driver monitoring, sequencing and energy management; amplifiers/radio frequency and microwave, which are used to condition analog signals; sensors and actuators; and digital signal processing and system products, which are designed to execute software programs, or algorithms, associated with processing digitized real-time, real-world data.
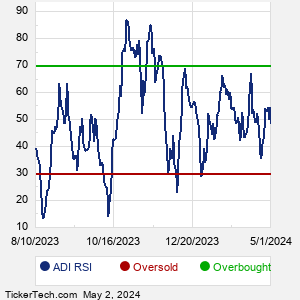
When researching a stock like Analog Devices, many investors are the most familiar with Fundamental Analysis — looking at a company's balance sheet, earnings, revenues, and what's happening in that company's underlying business. Investors who use Fundamental Analysis to identify good stocks to buy or sell can also benefit from ADI Technical Analysis to help find a good entry or exit point. Technical Analysis is blind to the fundamentals and looks only at the trading data for ADI stock — the real life supply and demand for the stock over time — and examines that data in different ways. One of these ways is called the Relative Strength Index, or RSI. This popular indicator, originally developed in the 1970's by J. Welles Wilder, looks at a 14-day moving average of a stock's gains on its up days, versus its losses on its down days. The resulting ADI RSI is a value that measures momentum, oscillating between "oversold" and "overbought" on a scale of zero to 100. A reading below 30 is viewed to be oversold, which a bullish investor could look to as a sign that the selling is in the process of exhausting itself, and look for entry point opportunities. A reading above 70 is viewed to be overbought, which could indicate that a rally in progress is starting to get crowded with buyers. If the rally has been a long one, that could be a sign that a pullback is overdue. |