Accenture is a services company. Co.'s services include: Strategy and Consulting, which works with C-suite executives and boards of organizations, helping them formulate their strategy; Technology, which includes services and solutions such as cloud, systems integration and application management, and infrastructure services; Operations, which operates business processes on behalf of clients for specific enterprise functions; Industry X, which combines its digital capabilities with engineering and manufacturing capabilities; and Song, which includes growth, product and design, technology and platforms, creative, media and marketing strategy, and campaign, content and channel orchestration.
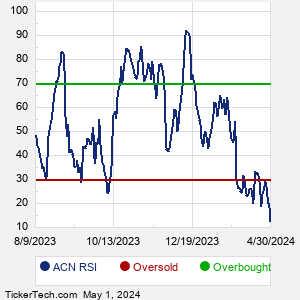
When researching a stock like Accenture, many investors are the most familiar with Fundamental Analysis — looking at a company's balance sheet, earnings, revenues, and what's happening in that company's underlying business. Investors who use Fundamental Analysis to identify good stocks to buy or sell can also benefit from ACN Technical Analysis to help find a good entry or exit point. Technical Analysis is blind to the fundamentals and looks only at the trading data for ACN stock — the real life supply and demand for the stock over time — and examines that data in different ways. One of these ways is called the Relative Strength Index, or RSI. This popular indicator, originally developed in the 1970's by J. Welles Wilder, looks at a 14-day moving average of a stock's gains on its up days, versus its losses on its down days. The resulting ACN RSI is a value that measures momentum, oscillating between "oversold" and "overbought" on a scale of zero to 100. A reading below 30 is viewed to be oversold, which a bullish investor could look to as a sign that the selling is in the process of exhausting itself, and look for entry point opportunities. A reading above 70 is viewed to be overbought, which could indicate that a rally in progress is starting to get crowded with buyers. If the rally has been a long one, that could be a sign that a pullback is overdue. |